Python的一个强大之处就是可以利用第三方库将处理好的数据快速图形化,利用可视化数据来进行下一步的直观分析。
在[Python]用python作图?快速开始matplotlib中,通过一个matplotlib画图的例子解释了画图的一般步骤。
这篇文章将通过例子介绍用seaborn进行作图的方法。
Pairplot corrplot(heatmap)
import numpy as np
import pandas as pd
from sklearn.datasets import load_iris          #sklearn.datasets里有很多数据集
from matplotlib import pyplot as plt
import seaborn as sns                           #导入seaborn库
import seaborn.linearmodels as snsl

iris=load_iris()                                #导入鸢尾花数据

d=pd.DataFrame(iris.data,columns=["sepal_length","sepal_width","petal_length","petal_width"])
d["species"]=iris.target                        #增加一列,为鸢尾花的类别

d.loc[d["species"]==0,"species"]="setosa"       #把类别这一列数值为0的替换为setosa
d.loc[d["species"]==1,"species"]="versicolor"   #把类别这一列数值为1的替换为versicolor
d.loc[d["species"]==2,"species"]="virginica"    #把类别这一列数值为2的替换为virginica

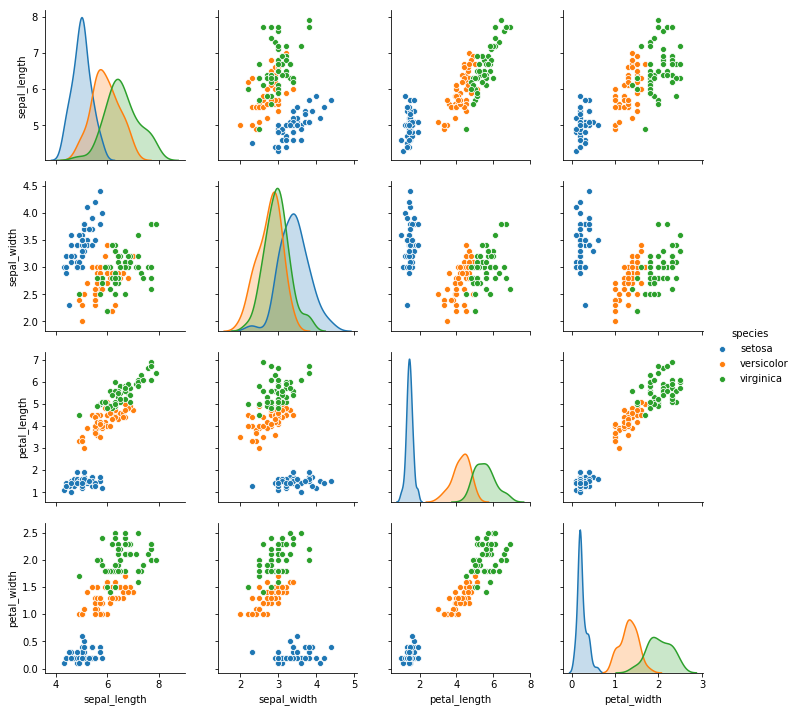
sns.pairplot(d,hue="species")
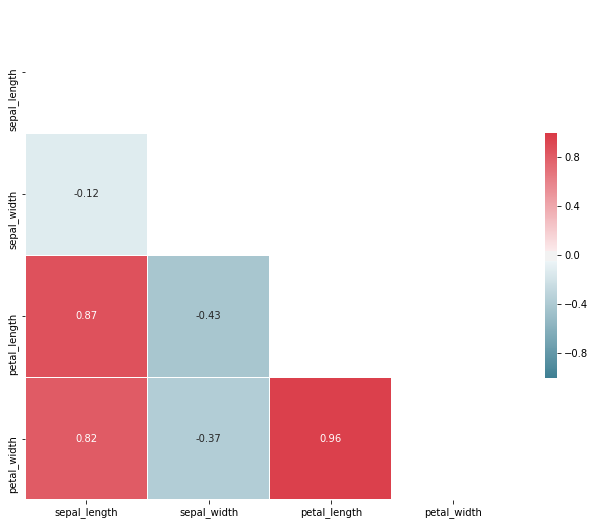
corr = d.corr()
print(corr)


# Generate a mask for the upper triangle
mask = np.zeros_like(corr, dtype=np.bool)
mask[np.triu_indices_from(mask)] = True

# Set up the matplotlib figure
f, ax = plt.subplots(figsize=(11, 9))

# Generate a custom diverging colormap
cmap = sns.diverging_palette(220, 10, as_cmap=True)

# Draw the heatmap with the mask and correct aspect ratio
sns.heatmap(corr, mask=mask, cmap=cmap, vmax=1, center=0, vmin=-1,
            square=True,annot=True, linewidths=.5, cbar_kws={"shrink": .5})

# sns.heatmap(corr, d)
plt.show()

